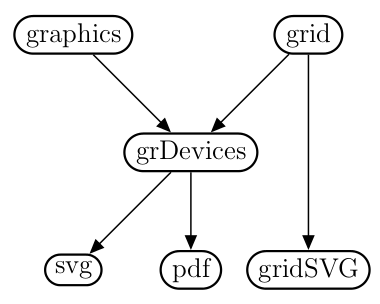
gridSVG is a package for R that turns a grid plot into an SVG image. Under the supervision of Dr. Paul Murrell I undertook both an honours project, and a Masters thesis developing gridSVG. A basic illustration of how gridSVG differs from the built-in SVG device is shown below.

The key advantage of using gridSVG is that new animated, interactive graphics can be produced more easily and transparently than by using the Cairo-based SVG device (see SVGAnnotation for an alternative approach that uses the SVG device). Because the lattice and ggplot2 packages use grid, gridSVG can add these features to plots produced by these packages. gridSVG only works with grid plots, to create animated and interactive plots from R’s base graphics engine see SVGAnnotation.
Features
Here are a list of some key features that gridSVG is able to provide:
- Animation (
grid.animate()) - Hyperlinking (
grid.hyperlink()) - Interactivity (via JavaScript), see
grid.garnish()andgrid.script() - SVG-specific features including:
- Clipping paths (
grid.clipPath()) - Custom fonts (
getSVGFonts()andsetSVGFonts()) - Gradients (
grid.gradientFill()) - Masking (
grid.mask()) - Patterns (
grid.patternFill()) - Filters, e.g. blurring, lighting effects, drop shadows. (
grid.filter()) - Custom elements, enabling content such as
<foreignObject>elements to be included in a gridSVG image. (grid.element())
- Clipping paths (
Download
- Download gridSVG via CRAN. To install gridSVG simply run
install.packages("gridSVG")from within R. - Download development version of gridSVG via R-Forge (not recommended)
Documentation
This documentation may lag behind the latest version and is not intended to be canonical. Use the documentation provided with the package for up to date documentation.
Some documentation of the behaviour of gridSVG is available below. This is provided to give visual demonstrations as well as functioning as documentation.
Demonstrations
Demonstrations of the potential of gridSVG are linked below. A modern web browser is required to view these images. Google Chrome, Mozilla Firefox and Apple Safari are all capable of viewing these examples. More recently, web browsers on Android and iOS have become capable of viewing the examples.
- Tooltips
- arrayQualityMetrics Figure
- Teaching Example
- Stock Ticker
- Gapminder — Single Panel
- Gapminder — Multi Panel
- HTML5 Interactivity
Further examples of gridSVG have been created as part of my
Masters Thesis (see ‘Examples’ in the
previous link). In particular these can be run via the sjpMScThesis package
that is a companion package to my thesis. The key difference that these
examples offer is that the content of the gridSVG image is being updated via an
R web server, enabling reactive statistical graphics.