

Simon Potter
simon.potter@auckland.ac.nz
and Paul Murrell
paul@stat.auckland.ac.nz
Department of Statistics, University of Auckland
September 13, 2013
Abstract: The grImport2 package imports vector images that are stored in the SVG image format for inclusion within images generated by R. The original grImport package performs the same task, but instead using PostScript images as its source image format. This technical report describes the steps taken to improve not only the grImport package, but also follows the development of two new packages, grImport2 and grConvert. The latter, grConvert, converts images from popular vector image formats (PostScript, PDF and SVG) into valid input formats for grImport and grImport2. The grImport2 package is an entirely new package that does not suffer from some limitations of the grImport package, whose limitations are primarily due to the dependence on the PostScript image format.
The aim of this work for the Google Summer of Code was to improve upon the grImport package [1] for the R Project [2]. grImport is a package for importing PostScript images into R, which are intended to be used within plots created with R graphics. The original goal was to accurately recreate the state flags of the United States of America. The set of flags are already hosted online by Toby Dylan Hocking (at http://sugiyama-www.cs.titech.ac.jp/~toby/flags/index.html) and serves as a good set of test cases to see where grImport needs improvement.
One example of a state flag that needs improvement is that of Colorado. This is demonstrated in Figure 1 where the original flag is shown on the left, and grImport's attempt at importing and rendering the image is shown on the right.
What Figure 1 shows us is that grImport is not parsing rectangles
correctly. More specifically, grImport does not understand
PostScript's [3] /rectfill and
/rectstroke operators and consequently it cannot draw them.
To correct this rather obvious flaw, support for these operators were
added to the grImport package, which now renders many flags
correctly without any further changes necessary. The corrected Colorado
state flag is shown below in Figure 2.

Figure 2 shows us that indeed, this simple fix does correct the rendering of the state flags of Colorado. In fact, it greatly improves the appearance of most state flags. However, limitations in both the PostScript image format and R graphics mean that it is simply not possible for all of the state flags to be imported by grImport. An example of this is PostScript's lack of support for semi-transparency when painting within in graphics objects e.g. a path or a rectangle. Additionally, R graphics does not support clipping to paths, only to horizontally and vertically aligned rectangles. These are fundamental limitations that cannot be worked around by grImport and was the primary motivation for the development of the grImport2 [4] package.
To begin with, let us first demonstrate an example where the grImport2 package illustrates an improvement. This is shown in Figure 3 where the flag of Hawaii renders with a few errors in grImport. The key problems with grImport's rendering is that clipping is not applied either to the horizontal stripes or the boundaries of the Union Jack. The key reason why grImport does not perform clipping is because PostScript clips to a path, which is not possible with the R graphics engine. However, because grImport2 can work out the bounding box of a clipping path, it can also clip to the bounding box. The result is that the flag of Hawaii now renders correctly with grImport2, where it could not do so with the existing grImport package.


Despite the aforementioned improvements, there are some features of images that cannot be rendered in R graphics at all. We have already mentioned clipping to a path, but another example of this is gradient fills. A state flag that uses this feature extensively is the state flag of Kansas, where much of the central features of the flag are filled using linear gradients. This graphical feature is not currently supported by the R graphics engine, but it is supported by the gridSVG package [5]. The gridSVG package enables us to use features of SVG [6] within R, the key limitations being that the image must be a grid [2] plot, and that the resulting image must be an SVG image which is generated by gridSVG.


Figure 4 demonstrates that that if we support linear gradients, as is the case when we render with gridSVG, the state flag of Kansas can render correctly.
To summarise, while it is possible to further improve grImport's understanding of PostScript, further development of grImport is fundamentally limited by the features of both PostScript and the R graphics engine. These limitations are not present when using SVG as a source image format instead of PostScript. These are the primary motivations for the development of a new package, grImport2, rather than further extending the grImport package.
grImport2 targets the SVG image format, which contains a superset
of the functionality of the R graphics engine. One of the key advantages
of SVG is that it is a grammar of XML [7], which
means that it is straightforward to parse with the XML package
[8]. For grImport2, the use of the SVG
format is similar to grImport's use of its custom RGML image
format, which is also a grammar of XML. SVG and RGML are similar due to
the fact that both XML grammars attempt to describe how to draw an image.
The key difference is that grImport2 can import the SVG image
immediately, but grImport must first create the RGML description
(via PostScriptTrace()), which can then be imported. Another
key benefit of targetting the SVG image format is that we not only have
complete access to the features of the R graphics engine, but also the
features of SVG when the gridSVG
package is used.
It may indeed be the case that PDF [9] supports all of the required graphical features, but it would still require the PDF images to be parsed in some way. It is this parsing step that is trivial with the SVG image format (with the XML package) but far more difficult with PDF. In order to parse PDF, we would need write a fairly large amount of code, especially considering most existing PDF libraries do not expose the graphical components of a PDF document. They instead choose to provide only a high level rendering function. Furthermore, even if PDF were even more graphically sophisticated, SVG is sufficiently capable of drawing visually identical plots to PDF.
A complication with SVG is that unlike PostScript and PDF it does not require the use of a physical coordinate system (e.g. points). This, among other things (such as attribute precedence), complicates the process of importing an SVG image. However, if we restrict the SVG we support to the SVG that is generated by the Cairo graphics library [10], then we know that the SVG images that we import are guaranteed to belong to a common coordinate system and other features of the image will be flattened, making it easier to parse. In particular, this means that grImport2 does not need to parse all of the SVG image format, only the subset of SVG that Cairo generates. Furthermore, because Cairo is is a supported graphics renderer for many open source libraries that import vector images, we know that it is possible for many input formats to be mapped to the Cairo SVG subset of SVG.
We have established that the task of importing vector images for grImport2 is greatly simplified when grImport2 imports only the subset of SVG that the Cairo graphics library draws. Additionally, it is not necessary to target one specific image format, instead we can leverage existing libraries that already handle the specific image formats [11] [12] [13]. However, grImport2's responsibility is for importing graphics, not for dealing with image formats. The grConvert package has been created to create compliant vector images for importing with either grImport or grImport2.
The grConvert package takes advantage of the fact that there are several mature, performant, and easy-to-use libraries for parsing popular vector image formats. Another key advantage of these libraries is that they support rendering by the Cairo graphics library. This means that we can take any PostScript, PDF, or SVG image and render it to any image format that Cairo supports. For the purposes of grConvert, it only ever needs to use Cairo to render to either PostScript or SVG for grImport and grImport2 respectively.
The interface provided by grConvert is minimal as there is only
one function of note, convertPicture(). This function takes
an input vector image that is one of the supported formats (PostScript,
PDF or SVG) and exports either PostScript for grImport, or SVG
for grImport2. By default the types of images that we import or
indeed export are inferred by their file extensions to make most
conversions as simple as possible.
To use convertPicture(), consider the cases shown in Figure 5
where we convert various input images to SVG, and also to PostScript.
R> library(grConvert)
R> # Convert PS to SVG
R> convertPicture("1.ps", "1.svg")
R> # PDF to SVG
R> convertPicture("2.pdf", "2.svg")
R> # SVG to SVG -- flattening
R> convertPicture("3.svg", "3-new.svg")
R> # Convert an SVG image to PS for grImport
R> convertPicture("4.svg", "4.ps")
This simple interface allows us to create supported input images for grImport and grImport2. For grImport, this was a task previously left as an exercise to the user, but is now much more convenient with the grConvert package. The convenience of converting between vector image formats in R reduces the time and effort needed to produce valid images for grImport or grImport2. Furthermore, in the case of grImport2, it also guarantees that the SVG produced contain the restricted SVG that grImport2 targets.
At this point in the technical report, we have demonstrated some of the
capabilities of grImport2, but have not yet shown how this is
performed. There are only two steps necessary to draw images with
grImport2: reading, and drawing. Reading a picture is performed
using the readPicture() function. It expects a filename or
remote location that points to an image that should be consumed to create
a Picture object. This Picture contains all of
the information necessary to reproduce the imported image in R. Once the
image has been read in via readPicture(), we can reproduce
the image within R. An example of this is shown in Figure 6 where we have
a flag of New Zealand, which will be converted by grConvert into
Cairo SVG, and then read into R by grImport2.

R> # Converting the image
R> library(grConvert)
R> convertPicture("nzflag-original.svg", "nzflag-cairo.svg")
R> # Reading it into R
R> library(grImport2)
R> nzflag <- readPicture("nzflag-cairo.svg")
There are two high-level functions we can use to draw this
Picture object. We will first examine
grid.picture(). grid.picture() is a function
intended for use with the grid graphics system. It takes a
Picture object, and enables it to be drawn within any
grid viewport. For example, we can draw it to the entire page.
R> # 'expansion' is 0 so that we take up the entire page
R> grid.picture(nzflag, expansion = 0)

One problem that we can observe from the rendered image in Figure 7 is that the lines in the Union Jack are not clipped at all. To correct this problem, grImport2 can clip to the bounding box of any clipping paths in the image. This is demonstrated in Figure 8.
R> # Ensure we clip to the bounding box
R> grid.picture(nzflag, expansion = 0, ext = "clipbbox")

By clipping to the bounding box of any clipping paths, at least for this simple image, greatly improves the appearance of the flag. The rendering is not yet perfect, because the diagonal lines in the Union Jack are not clipped properly. However, we have reached the limitations of R graphics as it does not support this feature. We can leverage the gridSVG package to clip to these paths when it exports an SVG image. This is illustrated in Figure 9.
R> # Ensure we clip using clipping *paths*
R> grid.picture(nzflag, expansion = 0, ext = "gridSVG")
R> grid.export("nzflag-with-complex-clipping.svg")

The use of clipping paths instead of clipping rectangles improves the appearance of our flag so that it now renders identically to the source image.
We have focused on clipping, but there are further graphical features that we can use. For example, the central features of the state flag of Kansas contains linear gradients. These are not shown at all without the use of gridSVG, instead they are drawn using the current fill colour. This means that the use of gridSVG is beneficial, and in cases like these, essential for accurate reproduction of imported graphics.
R> convertPicture("kansas.svg", "kansas-cairo.svg")
R> kansas <- readPicture("kansas-cairo.svg")
R> # Use gridSVG features *and* gridSVG clipping
R> grid.picture(kansas, expansion = 0, ext = "gridSVG")
R> grid.export("imported-kansas.svg")

The second high level function that grImport2 provides for
working with Picture objects is called
grid.symbols(). It is used for drawing several copies of of a
picture at a set of (x, y) locations, with
specified sizes. For statistical graphics purposes, the most obvious use
for this function is to create custom plotting characters.
To demonstrate how this may be used, we will use a custom panel function
for the lattice package. The panel function will give us some
(x, y) locations to plot at and will also give a
random size for each of the pieces of the plot.
R> customPanel <- function(x, y, ...) {
R+     # Sizing the flags randomly for demonstration purposes
R+     sizes <- runif(length(x), min = 5, max = 10)
R+     grid.symbols(nzflag,
R+                  x = x, y = y,
R+                  default.units = "native",
R+                  size = unit(sizes, "mm"),
R+                  ext = "clipbbox")
R+ }
R> library(lattice)
R> xs <- rnorm(10, mean = 30, sd = 10)
R> ys <- rnorm(10, mean = 70, sd = 20)
R> xyplot(ys ~ xs, panel = customPanel)
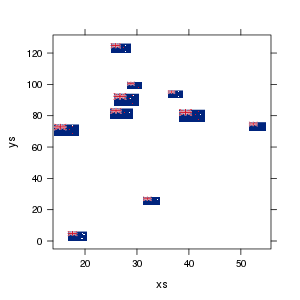
Figure 11 shows that we have an easy way of using custom data symbols in
grid plots if we use grid.symbols() instead of the
familiar grid.points() function. One drawback however is that
grid.symbols() can only draw one Picture object
repeatedly. To draw multiple custom symbols will require multiple calls to
grid.symbols().
One of the things you may want to do is change the appearance of a picture once it has been imported. There are two ways to do this, but we will first discuss the most convenient method; the second will be discussed later in this technical report.
The most convenient way to modify images imported by grImport2 is
to change their graphical parameters, for example the colours that are
being used within a flag. Both the grid.picture() and
grid.symbols() functions have an optional argument called
gpFUN. This argument should be a function that takes a
grid gpar object, and returns a modified version of
that object. This is a much simpler approach than writing custom methods
for Picture and related objects (as is the case with
grImport). Primarily this is because the task of creating
graphics objects should be undertaken by grImport2, but
changing the graphical parameters of pictures should be
configurable by the user.
As we have established earlier, the way in which the graphical parameters
can be modified is by the use of a function that takes a
gpar object and returns a modified gpar object.
We will construct a function that desaturates all of the colours in a
gpar object, and apply that to our flag of New Zealand.
R> # Create a gpar desaturation function
R> gpDesaturate <- function(x) {
R+     if ("col" %in% names(x))
R+         x$col <- desaturate(x$col)
R+     if ("fill" %in% names(x))
R+         x$fill <- desaturate(x$fill)
R+     x
R+ }
R> grid.picture(nzflag, expansion = 0, ext = "clipbbox",
R+              gpFUN = gpDesaturate)

Figure 12 shows how the gpFUN argument can be used to modify
the appearance of an imported image. The flag of New Zealand now appears
in greyscale colours. Not only is it possible to change the colours of an
image, but it is also possible to manipulate the image by showing only the
strokes in the image.
Many of the examples used so far appear relatively simple, perhaps with
the exception of the state flag of Kansas (Figures 4 and 10). However,
because the software libraries that grConvert relies upon are
sufficiently mature, the input images for grImport2 can be
equally as sophisticated as the images from which they were sourced. For
example, a type of picture that typically contains a lot of content are
pages in most PDF documents. We will demonstrate that
grImport2 can render complex pictures using using a page from the
grImport article published in the Journal of Statistical Software
[14]. Figure 13 also illustrates the use of the
pagenum argument in convertPicture().
pagenum
selects the page that will be converted from the source document to
PostScript or SVG.
R> # Convert page 2 to SVG for grImport2
R> convertPicture("grimport-jss.pdf", "complex.svg", pagenum = 2)
R> # Read in the page
R> page <- readPicture("complex.svg")
R> # Draw page
R> grid.picture(page, expansion = 0)
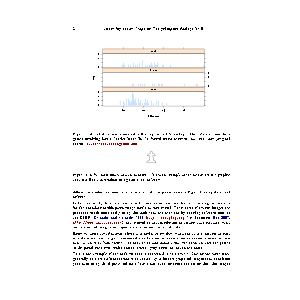
When rendering to the PDF graphics device, one can zoom in and observe that the image produced by grImport2 is imperceptibly different to the original page in the PDF document. The main reason why the content of the page is reproduced with a high degree of accuracy is because the Cairo graphics library translates text into an equivalent representation using SVG paths. A consequence of this translation is that grImport2 cannot import text as text, instead only the shapes are imported.
Much of the content of this technical report has discussed the motivation and the benefits to using grImport2, but this does not necessarily mean that grImport should be discarded. There are features that grImport has that grImport2 lacks. One of these features is the ability to import text as text. This means that it is possible to import a PostScript image containing text, then modify not only the text itself, but also its appearance (e.g. by changing its font). grImport2 can only import text as a path. This approach is problematic because paths are more difficult to modify and therefore generally support modification only to their graphical parameters.
Another advantage to grImport is that the R objects it creates to represent the imported image are far simpler, being comprised only of paths. This means that it is far simpler to modify an image if we know how to modify a path, rather than dealing with the multitude of groups and other types of objects that grImport2 creates. To demonstrate this, first consider the simple subset operation to show only a specific set of content in Figure 14.
R> PostScriptTrace("page27.ps")
R> page27 <- readPicture("page27.ps.xml")
R> survivalPlot <- page27[c(3:16, 18, 27)]
R> # Show survival plot
R> grid.picture(survivalPlot)
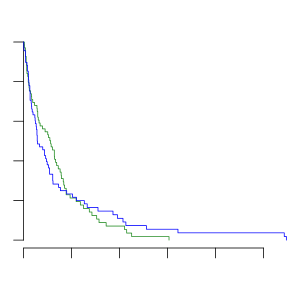
The subsetting operation shown in Figure 14 was simply reducing the image to only show paths 3—16, 18 and 27. Because everything drawn in grImport is a path, and the imported picture is simply a series of path drawing operations, the subsetting operation is simply keeping only some of the paths.
Performing similar manipulations of an imported picture using
grImport2 is more complicated process. Firstly, as is the case
with grImport we do not have any convenient way of knowing, for
example, which paths in the flag of New Zealand represent the stars or the
Union Jack. A second complication is that there is some structure to the
Picture object that closely matches that of the source Cairo
SVG image. This means that there are often trees of graphical content
represented in Picture objects. grImport does not
suffer from this complication as it manages a series of drawing
operations, rather than any trees of graphical content.
Despite these complications, and after some trial and error, we can subset
or add content to a grImport2 Picture object. Figure
15 shows an example where the Union Jack on the flag of New Zealand is
removed using subsetting operations on a PictureGroup object.
R> # Create a copy
R> nzstars <- nzflag
R> # Remove pieces that represent the Union Jack
R> # (children 3-8 of the main group)
R> nzstars@content[[1]]@content <- nzflag@content[[1]]@content[-3:-8]
R> grid.picture(nzstars, expansion = 0)

In general when modifying Picture objects, it may be useful
to know that they closely match the structure of the SVG image that they
were sourced from. For example, when modifying the flag in Figure 15, we
knew that the image was composed of a single
PictureGroup object, which contains many children. With this
information at hand, it is reasonably simple (albeit trial and error) to
work out which children of the PictureGroup are responsible
for drawing the Union Jack. However, it is clear that grImport
does make this type of task much simpler.
Another advantage of grImport is that it should be expected to work with any PostScript image, whereas grImport2 is dependent not only on SVG, but the specific subset of SVG that Cairo generates. grImport2 relies heavily on the structure of Cairo's SVG output so any change to Cairo could cause grImport2 to import the image incorrectly, or perhaps fail altogether. This is an important dependency to note but the Cairo SVG surface appears to be quite stable. It is unlikely to change in such a drastic manner that it would invalidate much of the parsing behaviour of grImport2.
In summary, if the goal is to accurately reproduce images in R then
grImport2 is a more complete solution. However,
grImport is simpler and its Picture objects can be
manipulated more easily; if that is of greater importance then
grImport may be a preferable solution. The cost of using
grImport instead of grImport2 is that reproduction of
images is unlikely to be as accurate.
We have demonstrated work performed as part of the Google Summer of Code for the R Project. This work resulted in minor changes to the grImport package, often leading to significant improvements in rendering. The grImport2 package was also created in order to work around limitations in the PostScript image format, in addition to limitations in R graphics. It is able to reproduce imported images with high fidelity, and when used with the gridSVG package, images can be reproduced to a greater degree than what R is capable of drawing.
In addition to developing improved tools for importing vector graphics, the grConvert package has been developed. It provides a convenient R interface for converting popular vector image formats into a format suitable for use in both grImport and grImport2.
The work demonstrated in this technical report was undertaken as part of the the Google Summer of Code 2013. Google funded the work entirely and without their support the development of this software would not have occurred.
The original versions of the flags shown in this technical report are freely available and have been sourced from the Wikimedia Commons. Thanks for the authors of these flags for providing such good examples for test cases.
This document is licensed under a Creative Commons Attribution 3.0 New Zealand License.
The code is freely available under the GPL. The described functionality of grConvert, grImport and grImport2 are present in the latest revisions of the packages on R-Forge.
In addition to the sources for the technical report and the packages described in the technical report, there is also a web page that shows and describes the improvements made to the rendering of the state flags of the USA. The web page is available at: https://dl.dropboxusercontent.com/u/54315147/import/state-table.html, with the source code for generating the web page available on GitHub at: https://github.com/sjp/grImport-flag-tests.