The VIT package (https://www.stat.auckland.ac.nz/~wild/VIT/)

The VIT package (https://www.stat.auckland.ac.nz/~wild/VIT/)
Using gridSVG to manage the task of drawing has several advantages:
gridSVG uses the grid graphics engine to produce SVG that retains the names of grid objects.
library(gridSVG)
grid.rect(name = "myrect")
grid.circle(name = "mycircle")
grid.ls()
myrect
mycircle

grid.export("example.svg")
<svg>
  <g transform="translate(0, 192) scale(1, -1)">
    <g id="gridSVG">
      <g id="myrect.1">
        <rect id="myrect.1.1" x="0" y="0" width="192" height="192"/>
      </g>
      <g id="mycircle.1">
        <circle id="mycircle.1.1" cx="96" cy="96" r="96"/>
      </g>
    </g>
  </g>
</svg>
We can load a web page with SVG content, but lose the ability to communicate with R.

All examples authored by Mike Bostock (creator of D3)
The key idea:
The problem:
Consider the following code:
library(grid)
pushViewport(viewport(name = "a"))
grid.rect(name = "a")
grid.circle(name = "a")
grid.draw(gTree(name = "a",
  children = gList(
    circleGrob(name = "a"),
    rectGrob(name = "a"))))
popViewport()
If we want to retain access to these names, and also produce valid SVG, we need a naming scheme!
The basic idea is to keep a counter for each time gridSVG meets a grob or viewport.
The resulting SVG ID is the name suffixed with the counter (separated by a .).
pushViewport(viewport(name = "a"))
a.1
grid.rect(name = "a")
a.2
And so on...
It is a bit more complicated than this.
We also have a way of controlling what the IDs look like (arguments to grid.export()):
prefix — Allows every generated ID to be prefixed with a given stringusePaths — Determine whether path information is retained in namesuniqueNames — Allow a direct mapping from grid names to SVG IDsThere are also further ways of controlling output: addClasses, annotate, and setSVGoptions()
gridSVG now exports name mapping information so we can find out what the IDs are:
gridSVGMappings() and getSVGMappings()
pushViewport(viewport(name = "a"))
grid.rect(name = "a")
What did these names turn into?
getSVGMappings("a", type = "vp")
[1] "a.1"
getSVGMappings("a", type = "grob")
[1] "a.2"
We can also find out how to select the content using XPath or CSS Selectors.
getSVGMappings("a", type = "vp", result = "xpath")
[1] "//*[@id='a.1']"
getSVGMappings("a", type = "vp", result = "selector")
[1] "#a\\.1"
Problem: We want to generate an image in-memory, but couldn't because gridSVG would always save to a file
Solution: Use the wonderful XML package.
This also gives us many other benefits!
Benefits of XML
library(ggplot2)
qplot(mpg, wt, data=mtcars, colour=cyl)
We'll try to remove the legend without using any plotting commands.

svgdoc <- grid.export("")$svg
legendNode <-
    getNodeSet(svgdoc,
               "//svg:g[@id='layout::guide-box.3-5-3-5.1']",
                c(svg="http://www.w3.org/2000/svg"))[[1]]
removeChildren(xmlParent(legendNode), legendNode)
saveXML(svgdoc, file = "ggplot-xml-fig2.svg")

We need a way of retaining viewport coordinate system information
We export a viewport's coordinate system to JSON, a structured data format.
pushViewport(viewport(x = unit(0.5, "npc"),
                      y = unit(0, "npc"),
                      width = unit(3, "inches"),
                      height = unit(7, "cm"),
                      xscale = c(0, 20),
                      yscale = c(0, 20),
                      name = "example"))
popViewport()
grid.export("coords-example.svg", exportCoords = "file")
{
    "example.1": {
        "x": 191.83,
        "y": -132.44,
        "width": 288.34,
        "height": 264.88,
        "xscale": [0, 20],
        "yscale": [0, 20],
        "inch":  96.11
    }
}
So how do we use this?
First, read in the data using gridSVGCoords()
Then use one of the following functions:
viewportConvertX()viewportConvertY()viewportConvertWidth()viewportConvertHeight()We can also recreate a viewport using viewportCreate()
We can convert grid units to SVG pixels
viewportConvertX("example.1", 3, "native")
[1] 110.45
viewportConvertY("example.1", 14, "native");
[1] 283.1
We can also go from SVG pixels to grid units
viewportConvertX("example.1", 110.45, "svg", "native")
[1] 3
viewportConvertY("example.1", 283.1, "svg" "native");
[1] 14
What we now have in gridSVG:
With this information at hand, we can re-build the LOESS smoother example using gridSVG
The XPath query used to select a legend from a ggplot2 plot:
//svg:g[@id='layout::guide-box.3-5-3-5.1']
A bit verbose, fortunately there is an alternative query language — CSS selectors.
CSS selectors are often used in JavaScript libraries
$(".header-nav") // jQuery
d3.selectAll(".header-nav") // D3
| CSS Selector | XPath Expression |
|---|---|
#test |
*[@id = 'test'] |
.test |
*[@class and contains(concat(' ', normalize-space(@class), ' '), ' test ')] |
body p |
body/descendant-or-self::*/p |
CSS Selectors offer a subset of the functionality of XPath, but are far easier to write
XML package doesn't let us use CSS selectors!cssselect can do this!selectr is a port of cssselect to R
library(selectr)
css_to_xpath("#test")
[1] "descendant-or-self::*[@id = 'test']"
css_to_xpath(".test")
[1] "descendant-or-self::*[@class and contains(concat(' ', normalize-space(@class), ' '), ' test ')]"
css_to_xpath("body p")
[1] "descendant-or-self::body/descendant-or-self::*/p"
Let's use this on a “real” document? Let's use the Department's Technical Report Blog.
library(XML)
page <- htmlParse("http://stattech.wordpress.fos.auckland.ac.nz/")
# What is the page title?
querySelector(page, "title")
<title>Stat Tech | Statistics Technical Blog</title>
# What are all of the links to technical reports?
querySelectorAll(page, "h1.entry-title > a")
[[1]]
<a href="http://stattech.wordpress.fos.auckland.ac.nz/2013-5-open-data-in-new-zealand/" title="Permalink to 2013-5 Open Data in New Zealand" rel="bookmark">2013-5 Open Data in New Zealand</a>

[[2]]
<a href="http://stattech.wordpress.fos.auckland.ac.nz/2013-4-generating-structured-and-labelled-svg/" title="Permalink to 2013-4 Generating Structured and Labelled SVG" rel="bookmark">2013-4 Generating Structured and Labelled SVG</a>

[[3]]
<a href="http://stattech.wordpress.fos.auckland.ac.nz/2013-3-generating-unique-names-in-gridsvg/" title="Permalink to 2013-3 Generating unique names in gridSVG" rel="bookmark">2013-3 Generating unique names in gridSVG</a>
...
Similarly we can query namespaced content like SVG images with querySelectorNS() and querySelectorAllNS():
svgdoc <- xmlParse(system.file("tests/svg-mathml.svg",
                               package = "selectr"))
# Search for <script> elements in the SVG namespace
querySelectorNS(svgdoc, "svg|script",
                c(svg = "http://www.w3.org/2000/svg"))
<script type="application/ecmascript" xlink:href="test2.svg.coords.js"/>
querySelectorAllNS(svgdoc, "svg|script",
                   c(svg = "http://www.w3.org/2000/svg"))
[[1]]
<script type="application/ecmascript" xlink:href="test2.svg.coords.js"/>

[[2]]
<script type="application/ecmascript" xlink:href="test2.svg.convert.js"/>
Perform a translation from CSS Selectors to XPath
css_to_xpath()Search for content matching a selector
querySelector() — first matchquerySelectorAll() — all matchesSearch for namespaced content (e.g. XHTML, SVG, MathML)
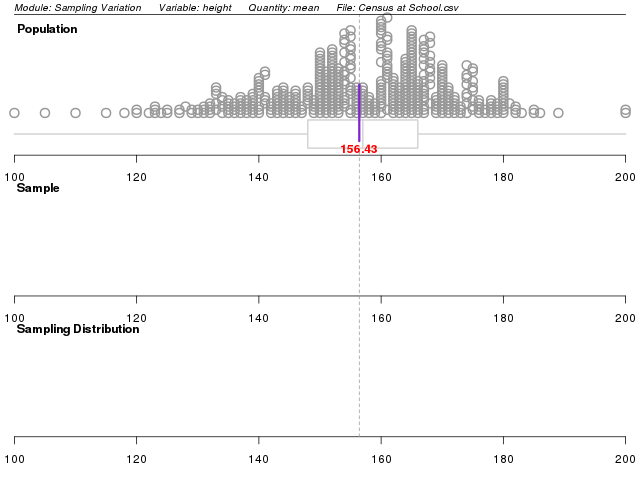
querySelectorNS()querySelectorAllNS()Let's have a look at an ARIMA diagnostics example.
To solve these problems, the 'animaker' package was created.
An atomic animation is the simplest of all animations
It has three parameters:
start — the starting timedurn — the durationlabel — a description for the animationatomic(start = 3, durn = 1, label = "example")
Atomic animations can be combined in two ways:
We can also make sequences of tracks and tracks of sequences.
A sequence
a <- atomic(start = 0, durn = 3, label = "a")
b <- atomic(start = 1, durn = 2, label = "b")
c <- atomic(start = 0, durn = 1, label = "c")
exampleSeq <- vec(a, b, c, label = "sequence")
plot(exampleSeq)

A track
d <- atomic(start = 0, durn = 10, label = "d")
exampleTrack <- trac(exampleSeq, d, label = "track")
plot(exampleTrack)

The whole point is to produce a timing scheme:
timing(exampleTrack)
  label start durn vec      vecNum trac  tracNum
1 a     0      3   sequence 1      track 1
2 b     4      2   sequence 2      track 1
3 c     6      1   sequence 3      track 1
4 d     0     10                   track 2
These animation sequences are only descriptions, we need to apply them
The TimingManager JS library performs this task by matching JavaScript functions with atomic animations (omitted)
We now have a way of managing animation sequences. Let's see what we can do with this!
grid.clipPath()

grid.mask()

grid.mask()

grid.patternFill()

grid.patternFill()

grid.gradientFill()

grid.filter()

grid.filter()
